Cases
/ Abu Dhabi Executive Office
Elevating Community Engagement: A Unified Perspective on Quality of Life
Abu Dhabi’s top leadership needed a comprehensive vantage point to gauge quality of life across the emirate’s diverse districts. Although data abounded—from social media sentiment and call-center logs to official surveys and community complaints—these vital insights were siloed under disparate agencies, agendas, and reporting methods. Pixonal collaborated with the Abu Dhabi Executive Office to create a narrative-driven command center, consolidating every relevant metric under clear thematic sectors (education, well-being, safety, culture, and more). This unified platform empowers leaders to quickly pinpoint pressing issues, understand context, and drill down to the smallest details of improvement initiatives.

Challenge: Fragmented Data, No Single Version of Truth
Scattered Inputs
Surveys, social media listening, complaints, CRM data, and mystery shopping results—each existed in isolation, making it difficult to see an integrated picture.
Inconsistent Reporting
Various departments and agencies followed different reporting standards, creating overlapping or conflicting agendas.
Leadership Blind Spots
Without a holistic lens, top decision-makers struggled to determine which districts were truly underperforming, and why certain improvements lagged behind others.
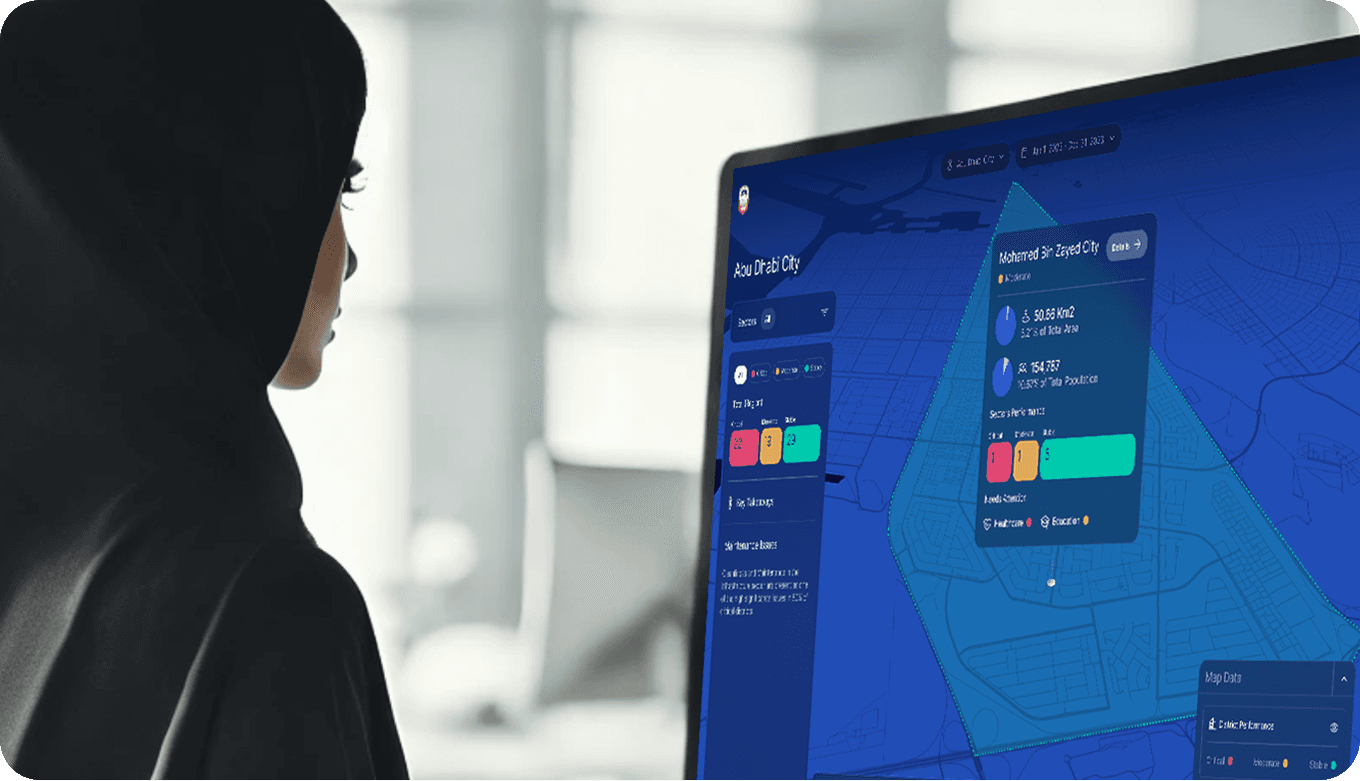
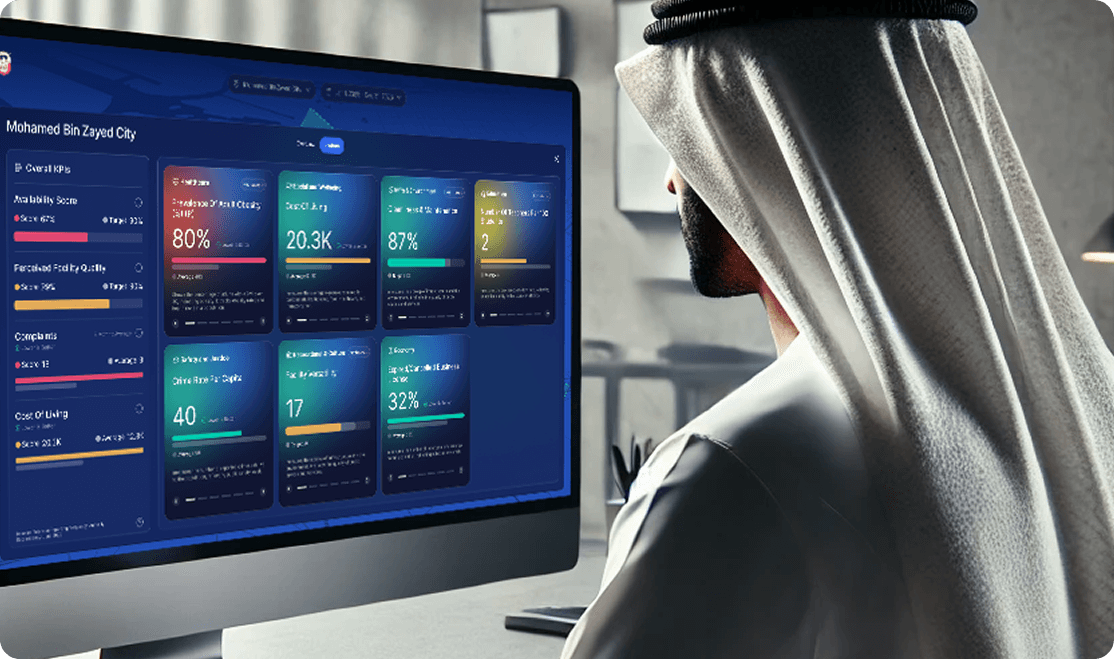
Unified Data Consolidation
We aggregated information from multiple entities, linking each metric with an associated district or city. This allowed leaders to assess individual sectors—like education or infrastructure—in direct relation to the area’s population, size, and historical trends.
Thresholds & Narratives
Instead of static dashboards, we introduced layered thresholds that highlight issues at a glance: critical, moderate, or healthy. Contextual storytelling within each sector (education, culture, safety, etc.) let leaders immediately grasp causes, timelines, and proposed solutions.
Command-Center Experience
At the highest level, an immersive, leadership-focused environment brings data alive in real time. Officials can pivot instantly from macro-level metrics (overall satisfaction, long-term well-being trends) to granular dives (individual action items, root-cause analysis, or historical improvements).

Initiative Tracking & Drill-Down
Key improvement strategies—such as neighborhood refurbishments, infrastructure builds, or cultural programs—are traceable within the same ecosystem. Leaders can see not just what’s happening, but why it’s happening, and how future plans align with strategic goals.
Key Features & Highlights
District/City Segmentation
Each location’s size, population, and usage patterns factor into the analysis, ensuring more equitable resource planning and context-aware decisions.
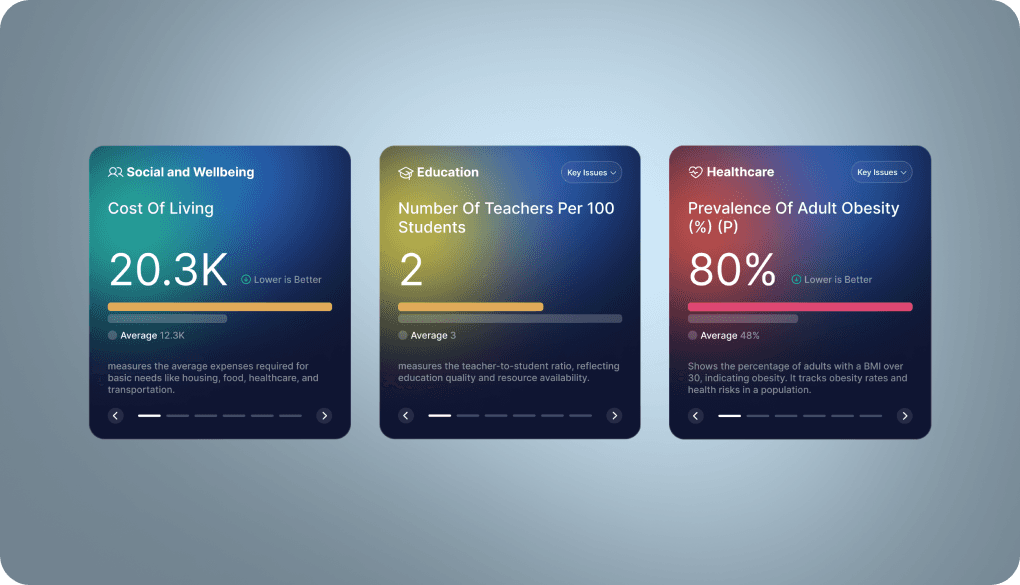
Sector-Based View
Quality of life is split into key themes—well-being, safety, culture, etc.—making it easy to see which aspect of daily life needs attention.
Automated Integration
Manual tasks are drastically reduced as feedback funnels from multiple sources into one consolidated pipeline, cleaned and contextualized automatically.
Narrative-Driven Interactions
Executive leadership no longer sifts through raw stats. Layered narratives guide them from top-level insights to granular action items, fueling more proactive governance.


Impact: End-to-End Visibility & Proactive Community Building
Leadership Clarity
By mapping out every district’s performance indicators, from safety metrics to cultural offerings, top officials can quickly spot gaps or emerging concerns.
Accelerated Issue Resolution
Color-coded thresholds and real-time alerts highlight critical issues—empowering decision-makers to resolve problems well before resident dissatisfaction escalates.
Deeper Stakeholder Engagement
With a single source of truth, cross-department collaboration becomes smoother. Agencies share consistent data and benchmarks, leading to faster, more cohesive interventions.
Foundation for Continuous Growth
The flexible design supports adding new data sources, comparing historical improvements, and scaling to other governance areas—ensuring Abu Dhabi’s leadership remains agile and informed.
By forging a comprehensive, narrative-focused platform for quality-of-life data, Abu Dhabi’s executives no longer rely on fragmented points of reference. They can track ongoing improvements, compare districts, respond swiftly to emerging needs, and ultimately foster a more engaged, vibrant community. This integration of thresholds, location context, and strategy aligns everyone—residents, agencies, and leadership—toward a shared vision of well-being and progress across the emirate.